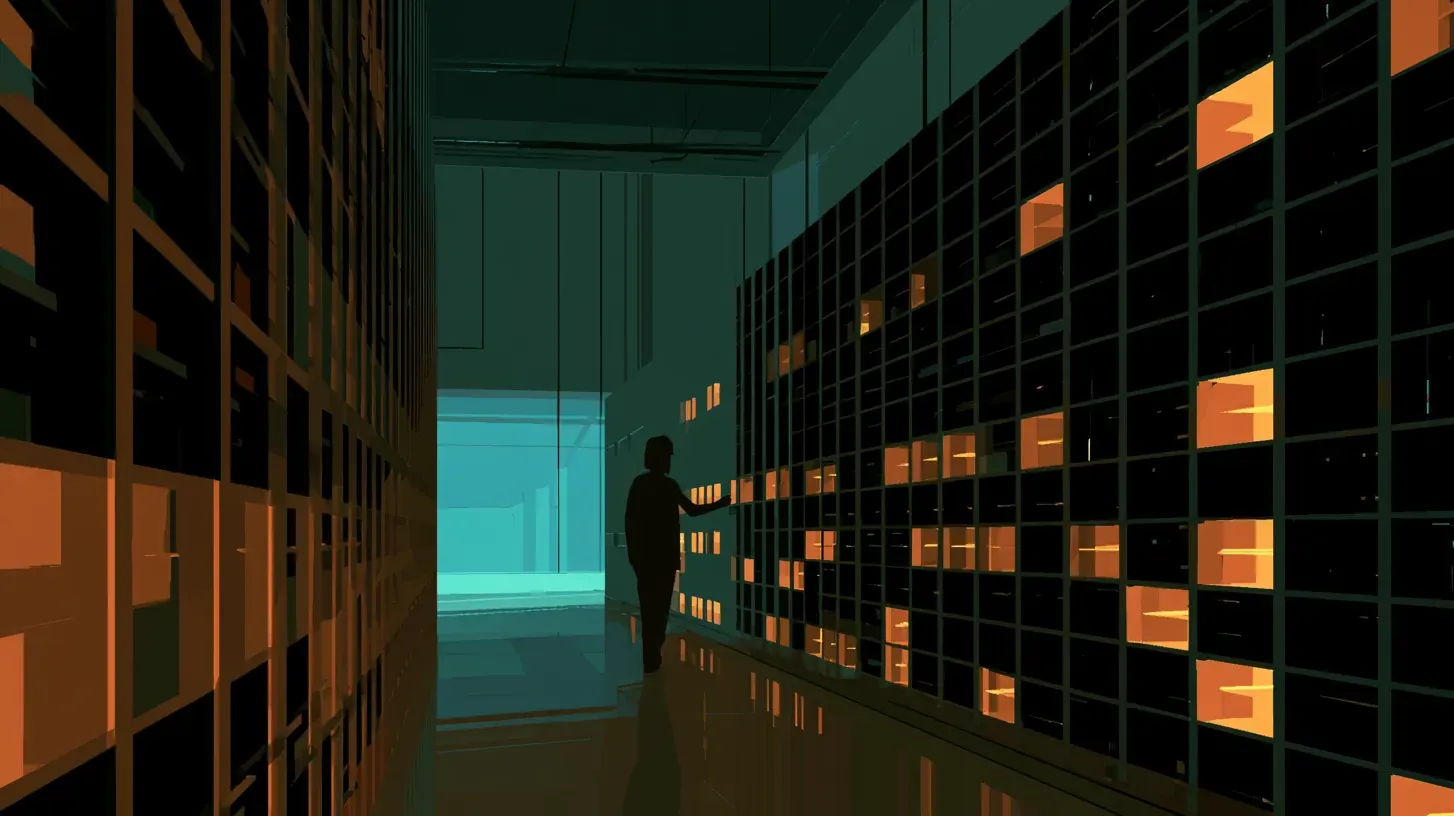
A lone figure walks a long server hall where amber-lit racks recede into teal darkness.
Infera · The Mechanism Series · Exhibit · Extends S2·07 The Physical Plant

Are data centers raising your electric bill?

Two serious bodies of evidence give opposite answers. This exhibit shows that both can be right at once, and lets you find the conditions under which each one holds.

Illustration from the Infera image archive, made with Midjourney. Not a photograph of a real facility or home.

~16 min readPublished 20 October 2026Evidence through 2 October 2026 · market data through July 2026FACT read at primary or official releaseREPORTED secondary accountINFERENCE Infera reading
The case for lower bills
−6%

Average residential rates in the average state, 2019 to 2024, compared with what they would have been without the data centers built in that period. REPORTED

EPRI researchers, working paper, June 2026
The case for higher bills
$23.1B

Added to what other PJM customers pay across three capacity auctions because of data center load, per the grid's independent market monitor. FACT

Monitoring Analytics, IMM, January 2026

Both numbers are real. They come from different years, different places and different mechanisms. The rest of this page takes them apart.

Two stacked views of one city skyline: above, towers fading into teal haze; below, the same towers glowing orange at street level.
The same city, read two ways. Illustration from the Infera image archive, made with Midjourney. Not a photograph of a real facility or home.


At a glance

The question
Are data centers raising household electric bills?
Strongest evidence
PJM's independent market monitor attributes $23.1 billion in added capacity costs across three auctions to data center load FACTofficial analysis; national studies through 2024 found average rates fell where load grew. REPORTEDworking papers
Main uncertainty
The national studies end before the 2025 price shock reached homes, and no household-level study yet covers 2025 and 2026. PJM covers about a fifth of the country.
Where Infera stands
We argue the answer is conditional: it depends on spare supply, who pays for new grid, and whether forecast demand arrives. We take no side on building data centers. This page was compiled with Claude; Anthropic buys large amounts of data center capacity.
Explore the exhibit 16 min
  1. A · The auctionThe capacity price rose more than ninefold in the 2025/26 auction. FACT
  2. B · Who gets the blameData centers, a rule change and two reliability plants each claim billions, using separate counterfactuals that cannot be added. FACT REPORTED
  3. C · The kitchen tableA typical DC household's capacity line rose about $10 a month; the data center share is 63 to 75 percent depending on how load is counted. REPORTED The split is Infera arithmetic. INFERENCE
  4. D · The windowsThe studies that found lower bills stop in 2024, before the price shock reached homes. FACT
  5. E · The three dialsWhere supply is tight, grid costs are spread to everyone and forecast demand arrives, the evidence points to higher bills; change those conditions and it can point lower. INFERENCEfrom both sides' own caveats

How to read our labels. FACT means we read it at the primary source. It tells you what that source says: a company's own documentation, a study's finding in its own sample, a statute's text. It does not certify that the claim holds everywhere or that a product works as promised. REPORTED is a secondary account. INFERENCE is Infera's reading or model. WATCH is unconfirmed or open. Where a label needs more precision we add a note, such as company documentation, study finding, editorial model or search result.

EXHIBIT A · THE AUCTION

The price of keeping the lights on rose more than ninefold in one auction

PJM runs the grid for 13 states and Washington, DC. Every year it holds an auction that pays power plants to be available on the hottest and coldest days. The price is set in dollars per megawatt per day. Tap a year for its price.

A silhouetted figure reaches toward a wall of glowing orange server racks in a long hall.
Illustration from the Infera image archive, made with Midjourney. Not a photograph of a real facility or home.

The 2025/26 auction cleared at $269.92, up from $28.92 the year before. Every auction since has hit the price cap set with the 13 governors and FERC. FACT
RTO clearing price, $/MW-day UCAP. 2025/26 cleared higher in two zones: $466.35 in BGE (Maryland) and $444.26 in Dominion (Virginia). Sources: PJM, Citizens Utility Board, IEEFA.
EXHIBIT B · WHO GETS THE BLAME

Every driver can claim a big share, and the claims add up to more than the bill

The 2025/26 auction cost PJM customers $14.7 billion, up from $2.2 billion. Two expert analyses each asked what the bill would have been without one driver. Switch each driver on to stack its claimed share against the actual total.

Data center figure: IMM, load above and within the embedded forecast, $9.33 billion. Rule change ($4.4 billion, revenue 49.1% higher) and reliability-must-run treatment of Brandon Shores and Wagner ($4.3 billion, 41.2% higher): Synapse for the DC Office of People's Counsel, April 2025. Each uses its own counterfactual, so they cannot be added. That is the point of the stack.

INFERENCE When drivers interact, a scarce grid makes each one more expensive than it would be alone. Each side can then credibly blame the driver it prefers. The useful question is which drivers policy can change, not which one is "the" cause.

EXHIBIT C · FROM AUCTION TO KITCHEN TABLE

What one Washington household paid, and how much of it you assign to data centers

For a typical DC household, the capacity line on the bill went from about $3 a month to about $13 when the 2025/26 auction took effect in June 2025 REPORTED. Move the slider to the share of that $10 increase you attribute to data centers. The marks show where each source lands.

An apartment block at night, a few windows lit warm orange and cool teal.
63%
Figures from Synapse for the DC Office of People's Counsel (April 2025); 63% share of the 2025/26 price increase from the IMM, as reported by IEEFA. The 63% counts only data center load above what PJM's forecast already held ($7.74 billion); counting all data center load ($9.33 billion, as in Exhibit B) gives about 75%. The per-month split is Infera arithmetic on those two figures, not a published estimate. For scale: Pepco's June 2026 DC increase was $8.79 a month (6.2%) at 614 kWh, and PECO's was about $5 (about 5%), each from several causes.
EXHIBIT D · THE WINDOWS DO NOT OVERLAP

The studies that found lower bills stopped counting before the price shock reached homes

Drag through the years. Each bar is the span of data a source can see. The shaded band is when the new PJM capacity prices are on household bills.

Rows of apartment windows at night, most dark, a few lit.
2025
SourceCoversFindingLabel
Watten, Bistline, Blanford (EPRI)2015–2024, statesDoubling data center capacity lowers residential prices about 3.5% (95% range −12.1% to −1.4%). Authors warn supply limits or unrealized demand could reverse it.REPORTED
Garimella (Rutgers)2014–2024, 24 statesBill effects from −$2.00 to +$2.09 a month on a $164 average bill; none robustly significant. Title: "Mostly not. Yet."REPORTED
LBNL and Brattle, 2026 edition2019–2025, statesHighest load growth states saw all-sector real prices fall over 1¢/kWh; the residential link is weaker. Capacity added 0.9¢/kWh to PJM wholesale costs in 2025.FACT
Monitoring Analytics (IMM)Auctions for 2025/26–2027/28Data center load added $9.33B, $7.27B and $6.50B to the three auctions; 39.6% of 2027/28 revenue.FACT
EXHIBIT E · THE THREE DIALS

Set the conditions; see which way the evidence points

The researchers on both sides name the same three conditions in their own caveats. Set each one for the place you care about.

A skyline in two bands: towers in teal haze above, a dark city with a thin orange glow below.
Is there spare power supply?
Who pays for the new grid?
Does the forecast demand arrive?
A small figure stands at the end of a dark server corridor lit by a teal doorway and scattered amber lights.
BOTH SIDES, AT THEIR STRONGEST

The best argument each camp makes

Illustration from the Infera image archive, made with Midjourney. Not a photograph of a real facility or home.

Data centers are not the reason bills are rising

  • Big new customers spread fixed wire costs over more kilowatt-hours. Two national studies find lower rates where load grew. REPORTED
  • Nominal residential prices rose 33% from 2019 to 2025, driven mostly by distribution, transmission, storm and wildfire costs and gas prices. FACT
  • In PJM, market rule changes and reliability decisions each moved the 2025/26 auction by billions on their own. REPORTED
  • Voters who blame data centers rose from 28% to 53% in a year (Heatmap Pro), faster than the evidence moved. REPORTED

Data centers are already on your bill

  • PJM's own market monitor calls data center demand "the primary reason" for the capacity price spike. REPORTED
  • The monitor puts the added cost at $23.1 billion over three auctions, borne by other customers. FACT
  • The national studies end in 2024, before the price shock reached homes in June 2025 and before the largest campuses came online. FACT
  • Forecast load that is never built still raised the price: removing forecast data center load alone cut 2027/28 auction revenue by $6.24 billion. FACT

The fight crosses party lines. The Ratepayer Protection Act, pushed by Sen. Jon Husted (R-Ohio), passed the House 417 to 3. Sen. Martin Heinrich (D-N.M.) blocked fast Senate passage because the bill relies on voluntary state commitments, and he wants operators required to pay their energy costs REPORTED. Candidates in both parties are running against data centers this fall REPORTED.

WHAT THIS EXHIBIT DID NOT PROVE

We did not prove that data centers raised or lowered any specific household's bill. The capacity figures describe PJM, which covers about a fifth of the country. Hedged load does not pay auction prices directly, so the auction total is not the same as what customers paid. Exhibit C's split is our arithmetic on two published figures. This page leaves out water, land, local tax revenue and jobs, which drive much of the opposition; The Data Center Bill covers the tax side for Georgia.

What would change this read: household-level studies covering 2025 and 2026; utility filings that split capacity costs by cause; large-load tariffs that show whether data centers end up paying their own grid costs.

FORM YOUR OWN READ

Four questions to ask about your own utility

  1. Is your utility in a capacity market like PJM, or does it own its plants and set rates through a state commission?
  2. Does your state have a large-load tariff that makes data centers pay for the substations and lines built for them?
  3. How much of your utility's forecast growth is data centers that have signed contracts, as opposed to requests in the queue?
  4. When your rates last changed, what did the filing list as the causes, and in what proportions?
WHERE THIS SITS IN THE ATLAS

This exhibit gives S2·07 its first federal data point and tests its projection that buildout costs default to all customers. It also updates the premise that almost nobody is voting on the plant: on 3 November, data centers are a campaign issue in Ohio, Texas and Pennsylvania. INFERENCE